What constitutes a city map, and what is it for? The two most familiar maps of London both originated in the 1930s: the diagrammatic Tube map devised by Harry Beck in 1933, and the pocket A-Z invented by Phyllis Pearsall in 1935. They are essential aids for Londoners and visitors attempting to navigate the metropolis, and most other large cities have their equivalents.
 But city maps are almost as old as the city itself – and for much of history, they were not designed to help people find their way around. Prior to the Industrial Revolution, few cities were large enough to make that necessary. Despite its accuracy, the great marble map that hung in the Forum in Rome was not intended as a guide for visitors (they would have had to climb a ladder to read its upper portions) but to proclaim the imperial city’s prosperity and power.
From the clay tablets of the Babylonians to the latest satellite images, city maps have served a multiplicity of functions. They may come into existence as the work of surveyors and town planners before the actual cities they depict; they may delineate property ownership, express civic pride, or entertain the armchair traveller.
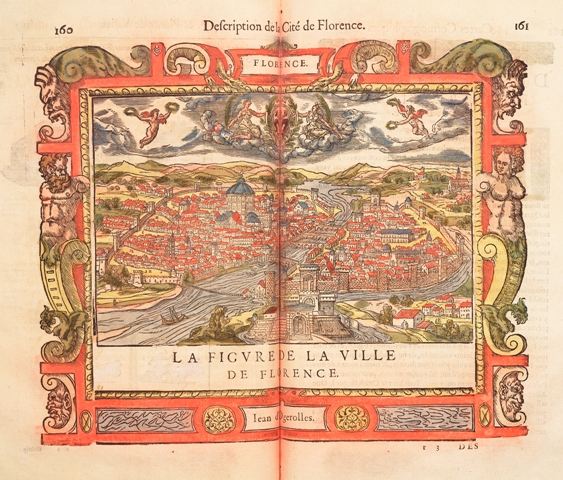
The first systematic collection of views of the world’s cities was Antoine du Pinet’s Plantz, pourtraitz et descriptions de plusieurs villes, printed in Lyon in 1563, using woodcuts to ‘show exclusively to the eye, in as lifelike a way as possible, the form, the position, the outskirts of the place’. Born in Besançon in 1515, du Pinet was a French Protestant pastor, an editor of Calvin, the author of a popular herbarium and translator of Pliny.
This was followed by Braun and Hogenberg’s Civitates Orbis Terrarum, published in six volumes between 1572 and 1617. Georg Braun, a canon of Cologne Cathedral, compiled the text while Frans Hogenberg assembled the copperplate engravings. Many cities are shown in bird’s-eye view, with the main buildings realistically depicted in perspective – a stunning imaginative achievement in an age before flight.
 The city maps of the Enlightenment were characterized by sober accuracy, with any pictorial element banished to vignettes around the borders. For the first time since antiquity, new cities were built on a regular, geometrical layout. The most ambitious of these plans was Peter the Great’s decision in 1703 to create a new Russian capital at the westernmost point of his empire to modernise his country and turn it into a European power.
Usually, a grid pattern was chosen – as in Edinburgh’s New Town – but sometimes a more imaginative plan was adopted. Karlsruhe in Germany was founded by Margrave Karl III Wilhelm of Baden Durlach in 1715 after a dream. Built on a radial pattern resembling the spokes of a wheel, it provided a model for Washington DC.
In the course of the 19th century, social reformers used maps to draw attention to the city’s extremes of wealth and poverty, its injustices, and its epidemics. In 1858, the clergyman Abraham Hume created a series of social maps of Liverpool using colour coding to denote “pauper streets” and “streets of crime and immorality”. In doing so, he anticipated by 30 years the much better-known “poverty maps” of London by Charles Booth.
By the early 1900s, aided by the development of urban railways, the world’s metropolises had become such vast and complex organisms that even those born there needed maps to find their way around, and the city maps with which we are all familiar came into being.
C.J. Schüler’s Mapping the City is published by Éditions Place des Victoires.
He will be appearing in conversation with Simon Garfield at the Kings Place Travel Festival on Sunday 23 June at 12.30 pm. Stanfords is delighted to be the official bookseller at this event.
To book tickets go to www.kingsplace.co.uk/travelfestival